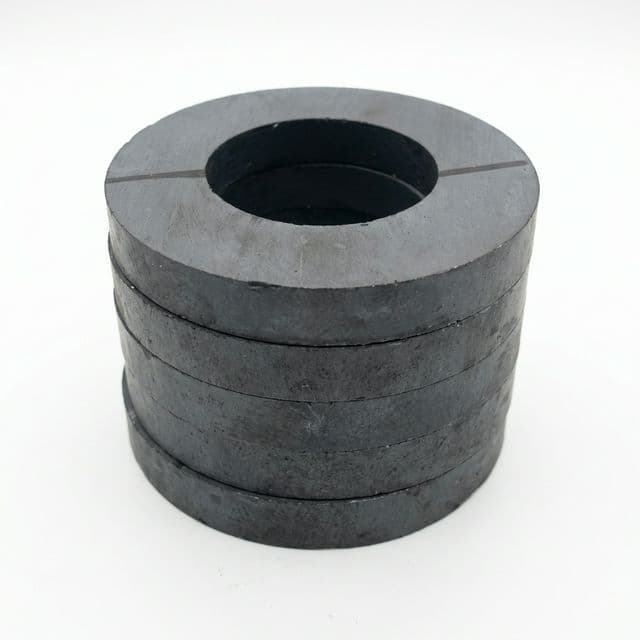
LogoMkSaaS Demo
  • Features
  • Pricing
  • Blog
  • Docs
Hybrid ModeTool + Report on one URL

2023 Ceramic Ring Magnets Made in China: calculate first, then validate origin, evidence, and risk

This is a single integrated page: the first screen delivers usable outputs, while the middle and lower sections provide method, sources, alternatives, and risk boundaries.

Published: April 21, 2026 · Last reviewed: April 22, 2026

Run the estimatorView key conclusionsSubmit RFQ directlyOpen manufacturer screening page
ToolSummaryRoutesMethodEvidenceBoundariesComparisonRisksFAQ
Tool Layer2-3 min output
Ceramic Ring Magnet Factory Quote Estimator (2023 baseline + 2024-2025 risk adjustment)
Enter geometry, tolerance, annual demand, and target lead time to get an explainable unit-cost band, lead window, risk level, and next action.
Boundary note: this estimator is for pre-RFQ screening and does not replace formal sample validation or magnetic performance testing.
Submit drawing for formal quote
Ready to run
Fill the key parameters and click “Generate result.” If you only have a target price, start with defaults and back-solve feasible tolerance and lead time.
Report Summary Layer

Core conclusions and key numbers

Decision statements first, evidence second. Every conclusion is tied to a source-backed number or explicit uncertainty marker.

For China-origin supply, lead time is source + process + customs
Factory loading + port lane + incoterm define delivery windows
5w10w

When target lead is <=6 weeks and tolerance is <=+/-0.08 mm, single-source execution materially increases delay and rework risk.

Landed cost must be scenario-based
Model FOB/CIF/DDP in parallel instead of one-point price

For China-origin sourcing, logistics and duty routes create meaningful spread; one-point pricing causes planning bias.

Origin concentration risk must be contract-visible
U.S. HS 850511 China share eased 79.8% (2023) -> 75.3% (2024), still concentrated

Lower concentration does not remove concentration risk; contract rolling forecast, dual-source switch rules, and emergency lot triggers.

"Made in China" is not a universal fit label
Validate magnetic need, compliance scope, and delivery window first
FIT ZONE

When out of boundary, switch to drawing review + pilot lot + dual-lane quotation workflow.

Fit / Not-fit audience matrix
Prevent wrong expectations: each sourcing stage needs different information granularity.
AudienceFitWhat you getNot-fit scenario
Sourcing engineer / SQEHighActionable cost bands, lead-time lanes, and risk triggersWhen you need final legal contract wording
Product / program managerMed-highFit boundaries, alternative comparison, and schedule impactWhen component-level magnetic circuit simulation is required
Retail-only buyerLowCan learn basics, but this is not a retail price-comparison pageUse cases centered on instant e-commerce checkout prices

China-origin sourcing routes (decision layer)

This section is specific to made-in-china intent: choose direct factory, trading-company consolidation, or agent-assisted sourcing.

Channel structure (encoded SVG)
Direct FactoryTrading CompanyAgent DDPTransparencyCoordinationDelivery Certainty
Port lane window (encoded SVG)
South China FOB 5-8wCIF Consolidated 6-10wDDP Full Service 7-12w
China-origin channel comparison
RouteCost transparencyDelivery stabilityCompliance burdenBest trigger condition
Direct factory (FOB)HighMedium (depends on your own logistics)Med-high (you consolidate all docs)You already operate strong sourcing + freight teams
Trading company consolidation (CIF)MediumMed-high (simplified handoff)Medium (document consistency needs auditing)Multi-SKU launch with compressed coordination bandwidth
Agent-assisted (DDP)Low-medium (lower line-item visibility)High (lowest operational burden)Low (agent leads compliance flow)You prioritize schedule certainty over lowest line-item price

Methodology and calculation basis

The method layer exposes formula, coefficients, and assumptions so you can judge whether outputs are transferable to your own program.

Calculation flow (encoded SVG)
InputOD/ID/Tol/VolumeComputeMass + Process + TradeRiskTolerance + ScheduleActionRFQ lane
Core equations
volume_cm3 = PI * ((OD/2)^2 - (ID/2)^2) * T / 1000
mass_g = volume_cm3 * 4.8
unit_cost = (material + process) * volume_factor * incoterm_factor
lead_window = base_lead + tolerance_penalty + qa_penalty +/- risk_buffer

Note: 4.8 g/cm3 is an engineering default. IEC 60404-8-1 indicates class-specific specification values should be used when available; material and process rates remain model coefficients, not contractual settlement terms.

Model coefficient table
ParameterDefault / rangeRole in outputBoundary note
Density4.8 g/cm3Sets part mass and material baselineReplace with measured density for special recipes
Tolerance range+/-0.03 to +/-0.50 mmDrives grinding complexity and scrap riskOutside range triggers boundary state
Target lead time3-20 weeksInteracts with process load for risk gradingCompressed targets trigger expedited recommendation
IncotermFOB / CIF / DDPImpacts logistics cost and transparencyDDP is convenient but least transparent; normalize comparisons using Incoterms A9/B9 cost buckets

Ready to move into RFQ review?

Compare against the factory-baseline page first, then submit your drawing and quality-package scope to reduce scope mismatch.

Submit RFQ reviewView factory baseline page

Evidence sources and boundary notes

The table below specifies source, date, data lens, and usage. Items without strong public evidence are marked as N/A with reason.

Evidence updated on April 22, 2026. WITS can still show no 2025 annual total, while USITC has announced full 2025 availability in DataWeb; verify both before locking annual conclusions.
Evidence ledger
MetricValueSourceDate markerUse / boundary
U.S. strontium apparent consumption (total)5,330 t (2023) -> 3,650 t (2024) -> 12,000 t (2025 estimate)USGS Mineral Commodity Summaries 2026 Data Release (Commodities CSV)Published February 6, 2026Proxy signal for ferrite precursor exposure, not a direct ring-magnet quote.
U.S. celestite import unit value (dollars per ton)82 (2023) -> 807 (2024) -> 160 (2025 estimate)USGS Mineral Commodity Summaries 2026 Data Release (Commodities CSV)Published February 6, 2026Used as volatility indicator for upstream feedstock timing risk.
U.S. net import reliance (strontium)100% (2023-2025 estimate)USGS Mineral Commodity Summaries 2026 Data Release (Commodities CSV)Published February 6, 2026Supply chain shock buffer must be planned in lead-time strategy.
U.S. net import reliance (rare-earth compounds/metals)>90 (2023) -> 53 (2024) -> 67 (2025 estimate)USGS Mineral Commodity Summaries 2026 Data Release (Commodities CSV)Published February 6, 2026Critical when benchmarking ferrite against NdFeB fallback paths.
NdPr oxide average price$75/kg (2023) -> $55/kg (2024) -> $69/kg (2025 estimate)USGS Mineral Commodity Summaries 2026 Data Release (Commodities CSV)Last checked April 21, 2026Counterexample anchor: NdFeB economics can shift as NdPr prices rebound.
Permanent magnet test-method boundaryIEC 60404-5: methods for B, J, H measurements and demagnetization/recoil curvesIEC 60404-5:2015 product scopeLast checked April 21, 2026Defines what constitutes comparable magnetic-property measurement conditions.
Permanent magnet specification boundaryIEC 60404-8-1: minimum magnetic-property values and dimensional tolerances by material classIEC 60404-8-1:2023 product scopeLast checked April 21, 2026Supports the page boundary: grade-specific values must come from class-specific specs.
EU RoHS restricted-substance thresholds0.1% for Pb/Hg/Cr6+/PBB/PBDE/DEHP/BBP/DBP/DIBP; 0.01% for CdDirective 2011/65/EU (consolidated), Annex IIConsolidated text checked April 21, 2026Applies to homogeneous materials in EEE and affects export compliance documentation.
REACH Article 33 communication triggerSVHC above 0.1% w/w requires communication; consumer requests answered within 45 daysRegulation (EC) No 1907/2006 (REACH), Article 33Consolidated text checked April 21, 2026Directly impacts RFQ package completeness for EU-bound shipments.
China exports, HS 850511 (permanent magnets, 2024)World total 3,236,652.39; U.S. destination 395,313.45 (thousand USD, 12.2% share)WITS / UN Comtrade country-year-product viewLast checked April 21, 2026Trade table context for supplier concentration and negotiation leverage.
U.S. imports concentration trend, HS 850511 (2023 -> 2024)World value 558,207.88 -> 478,125.34 (thousand USD, -14.3%); China share 79.8% -> 75.3%WITS / UN Comtrade country-year-product view (2023 and 2024)Last checked April 22, 2026Concentration eased year over year but remained high, so dual-source planning still matters.
HTS code boundary for ceramic permanent magnets (U.S.)HTS 8505.11.00.30 = Ceramic (units: No., kg) under 8505.11.00 heading in current USITC HTS search outputUSITC Harmonized Tariff Schedule search APILast checked April 22, 2026Use 10-digit line validation during RFQ; 6-digit summaries are too broad for drawing-level decisions.
U.S. duty trigger for China-origin entries (HTS linkage)8505.11.00 general duty 2.1%; footnote points to 9903.91.06 (+25% for China-origin entries effective Jan 1, 2026)USITC Harmonized Tariff Schedule search APILast checked April 22, 2026Treat as a landed-cost trigger; applicability and exclusions must be confirmed at entry planning.
U.S. imports, HS 850511 (2024)World total 478,125.34; China 359,791.11 (thousand USD, 75.3% share)WITS / UN Comtrade country-year-product viewLast checked April 21, 2026Supports risk section on origin concentration and dual-sourcing.
U.S. imports, HS 850511 (2025 annual snapshot)N/A for annual total on WITS page as of check date ("did not imports ... in 2025")WITS / UN Comtrade country-year-product viewLast checked April 22, 2026Treat WITS annual output as lagging for 2025 and cross-check against USITC DataWeb availability notices.
2025 annual data availability boundary (WITS vs DataWeb)USITC states full 2025 dataset is available in DataWeb; WITS country-year page can still show no annual resultUSITC DataWeb announcement + WITS country-year pageLast checked April 22, 2026Do not treat one portal lag as “no trade happened”; validate annual conclusions on the source database.
Incoterms execution boundary for cost comparisonICC Incoterms 2020 places aggregated costs in A9/B9 and security/clearance obligations in A4/A7ICC Incoterms 2020 guidance pagePage modified February 12, 2026; checked April 22, 2026Use this structure to compare FOB/CIF/DDP quotes on the same cost-accounting basis.
Known / unknown transparency
DimensionStatusExplanation
Material-side volatility signalKnownSupported by annual USGS datasets.
Global trade concentrationKnownWITS supports 2023-2024 trend reading (China share 79.8% -> 75.3%), with concentration still high.
2025 annual data availability across databasesPartially knownUSITC announces full 2025 availability in DataWeb, while WITS annual pages may lag; cross-database validation is required.
Grade-level density and magnetic-property detailsPartially knownIEC 60404-8-1 confirms class-specific minimums and tolerances, but full tabular values are not open on the product page.
Real-time single-supplier loading in ChinaN/ANot publicly available; requires supplier-level NDA data.
Drawing-specific scrap rateN/ANeeds first-run and pilot SPC data.

Concept boundaries and applicability conditions

Use this table to avoid over-interpretation: what can drive decisions directly, what is only a proxy signal, and what must be validated during RFQ.

Boundary-by-signal table
Signal / sourceUse directly forNot valid alone forMinimum executable action
USGS strontium seriesDetect feedstock volatility windowsDerive binding per-piece contract priceUse it as risk coefficient, not as quote base value
WITS HS 850511 + USITC 10-digit HTSRead concentration trend, origin exposure, and review priorityAssume drawing-level ferrite-ring tariff treatment directlyForce 10-digit code + Chapter 99 trigger check in RFQ before landed-cost decisions
IEC 60404-5 / 60404-8-1Align measurement and specification basisReplace grade-specific measured reportsRequire grade-specific test reports during RFQ
RoHS / REACH legal thresholdsDetermine whether compliance actions are triggeredReplace third-party lab verificationWrite thresholds into incoming-spec and document checklist
Counterexamples and limitations
When evidence is insufficient or scenario fit is weak, avoid forcing deterministic conclusions.
Counterexample scenarioWhy this page is limitedPractical fallback path
High energy-product requirement with strict volume limitsFerrite route may fail required flux-density targetsRun NdFeB fallback in parallel and re-check against NdPr sensitivity
Radial magnetization + tight tolerance (<=+/-0.08 mm) + under 6 weeksStacked process complexity and scrap risk widen output uncertaintyRun pilot lot with PPAP/FAI gate before locking production schedule
Decisions requiring full-year 2025 trade totalsWITS 2025 pages can still show empty totals, while USITC announces full 2025 availability in DataWebUse DataWeb for annual closure, keep WITS for cross-country structure checks, and revalidate quarterly

Comparison and alternatives

Comparison is not about absolute superiority, but conditional fit under specific boundaries.

Alternative options table
OptionCost predictabilityThermal boundarySupply-risk exposureBest-fit use case
Sintered ceramic ferrite ringMed-high (lower direct rare-earth exposure)Must be grade-verified (IEC 60404-8-1 provides class boundaries)Medium (U.S. 2024 same-code imports were 75.3% China by value)Programs prioritizing thermal stability and cost control
NdFeB ringMedium (more sensitive to NdPr cycle)Grade dependent (N/A single value)Higher (USGS NdPr avg $55/kg in 2024 -> $69/kg estimated for 2025)Space-constrained designs requiring high energy product
Bonded ferrite molded ringMedium (tooling-amortization sensitive)Depends on resin/process route (no reliable unified public value)Medium (strongly affected by lot size and tooling strategy)Complex geometry and rapid iteration in small lots

Risk matrix and mitigation actions

Risk matrix (encoded SVG)
ProbabilityImpactLMH
Program-level risk triggers
Risk typeTriggerMitigation
Misuse riskEstimator output treated as contract quote without RoHS/REACH trigger checksEnforce RFQ gate: drawing + quality package + 0.1%/0.01% limit declaration + Article 33 response flow
Cost riskLead target <=6 weeks with tolerance <=+/-0.08 mm (especially radial magnetization)Use expedited lane with weekly forecast lock and run pilot validation before scale-up
Scenario mismatch riskHigh energy-density requirement but ferrite selectedRun NdFeB fallback and include sensitivity to NdPr rebound from 2024 to 2025 estimate
Supply concentration riskSame-code import concentration >=70% from one origin while still single-sourcedDual-source minimum plus safety-stock trigger with emergency switch-lot plan
Classification / tariff riskChina-origin lane is fixed without validating 8505.11.00.30 mapping and 9903.91.06 triggerRFQ gate must include 10-digit HTS, Chapter 99 trigger, exclusion basis, and duty-cost ownership
Data availability riskAnnual 2025 decision made from one portal onlyClose annual view on DataWeb, use WITS for structure cross-check, and enforce quarterly revalidation
Scenario examples (assumption -> process -> outcome)

Scenario A: standard tolerance scale

Assumption: 800k pcs annual demand, +/-0.12mm tolerance, axial magnetization.

Process: Use baseline lead lane with quarterly rolling forecast lock.

Outcome: Cost volatility remains controllable; recommended default sourcing path.

Scenario B: compressed launch schedule

Assumption: Lead target below 6 weeks with PPAP package required.

Process: Switch to expedited lane, increase scrap buffer, and split shipments.

Outcome: Schedule can be met but unit-cost envelope widens materially.

Scenario C: low-volatility first

Assumption: Program allows +1 to +2 weeks in exchange for lower volatility.

Process: Use buffered lane with explicit safety-stock triggers.

Outcome: More stable total landed cost; suitable for long-life products.

StandardExpeditedBufferedCost baselineHigher cost, shorter leadLower volatility

FAQ

FAQs are grouped for decision intent: scope validation, risk judgment, and execution next steps.

High-frequency decision questions

Next step: turn estimator outputs into executable RFQ
Submit drawing, lead target, tolerance stack, and quality package scope in one structured review.
Submit RFQ via contactReview service levelsRead method docsRead related articles

Disclaimer: this page supports pre-contract sourcing decisions and does not constitute legal, compliance, or binding commercial terms.

LogoMkSaaS Demo

Make AI SaaS in days, simply and effortlessly

GitHubX (Twitter)BlueskyYouTube
Built withLogo of MkSaaSMkSaaS
Product
  • Features
  • Pricing
  • FAQ
Resources
  • Blog
  • Documentation
  • Changelog
  • Roadmap
Company
  • About
  • Contact
  • Waitlist
Legal
  • Cookie Policy
  • Privacy Policy
  • Terms of Service
© 2026 MkSaaS Demo. All Rights Reserved.