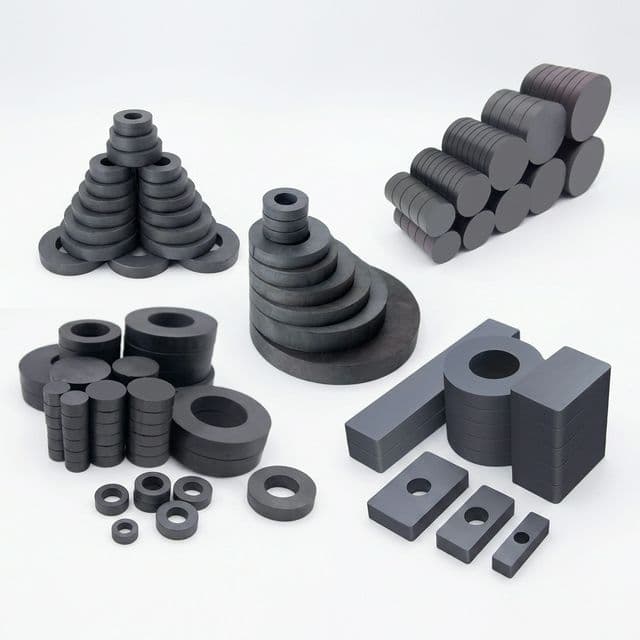
Ceramic Ring Magnets Manufacturer Checklist (2026)
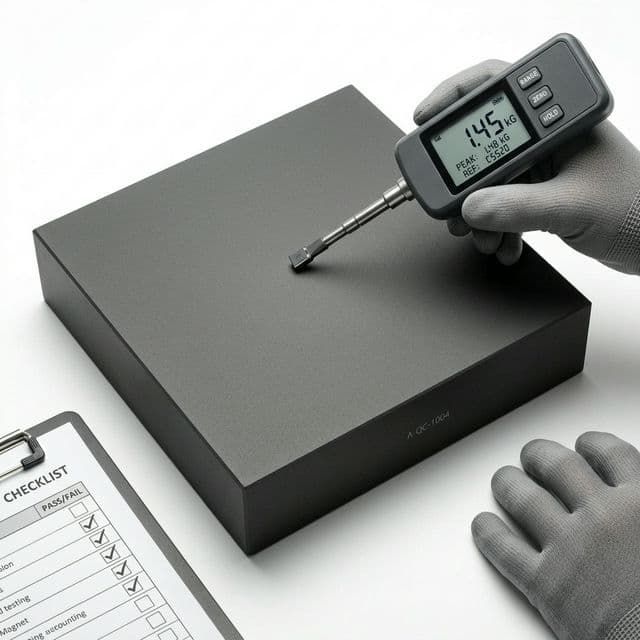
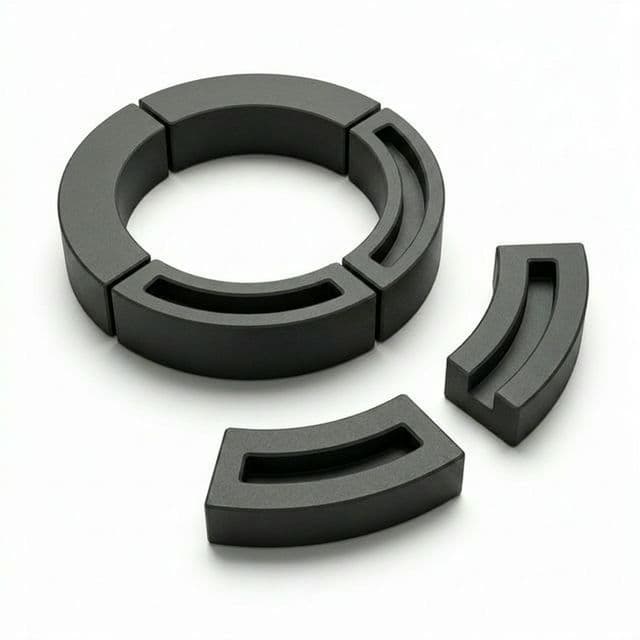
A practical buyer checklist for selecting a ceramic ring magnet manufacturer: process control, quality evidence, and RFQ readiness.
Published: April 23, 2026
Inquiry Email
Copy the email, or open your default email app to start an inquiry.